As a Realtor, one of the most common questions I'm asked is "How's The Market?"
Here you can get a detailed Fort Lauderdale market report or even customize your own report based on neighborhoods.
As an overview of the market from my perspective, it has definitely been a Seller's Market here in South Florida, but some people believe changes are coming due to COVID, Fort Lauderdale properties are staying on the market a little longer due to fewer buyers going out to look at homes.  That said, there's a difference between the luxury market and lower priced homes. Homes in the lower price ranges are still selling quickly. The Greater Fort Lauderdale Board of Realtors came out with statistics for the 1st Quarter of 2020 showing that single family homes in Fort Lauderdale have a 6.6 month supply of inventory. Keep in mind that 6 months is considered average. In the townhouse / condo category, there was a 7.9 month supply of inventory.
Fort Lauderdale is a highly desirable area, and neighborhoods vary greatly. If you're interested in a Fort Lauderdale market report, you might want to create your own, using specific neighborhoods.
Currently inventory is low throughout Broward County, so prices are holding steady and even continuing to increase in some areas. If we see a lot of inventory coming on the market in the future, things may change. But for now, inventory for single family homes in Broward County as a whole is only 3.9%. Inventory for townhouses & condos is at 6 months.
If you're not interested in all these statistics and just want to search homes for sale, you can click here to go to my Fort Lauderdale page or click here to go to my home page where you can search anywhere in Broward County.
In the first quarter of 2020, 379 single family homes closed in Fort Lauderdale with a median sales price of $485,000. This represents an 17% increase over the 1st quarter of 2019! The average list to sales price was 92.8% and the median time from list to contract was 81 days.
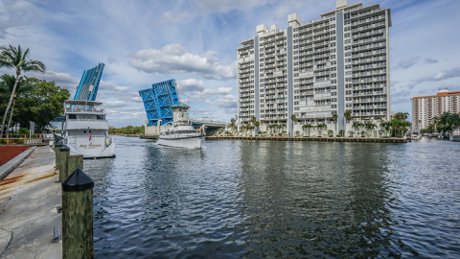 Looking at townhouses and condos, there were 508 closed sales in the first quarter of 2020. Interestingly, 51.8% were cash sales. I attribute this to the continued difficulty in financing condos in Florida. Personally I'm hoping that more condos will pursue FHA eligibility, as this would make it so much easier for young people to buy their first home. When I started in Real Estate back in 1998, there were many condos that could be purchased with FHA financing. Now days most condos require 20-30% down.
Continuing on with townhouses and condos, the median sales price in Fort Lauderdale for the first quarter was $315k, representing a 9.6% increase over last year. The average list to sales price was 92.4% and the median time from list to contract was 100 days.
If you haven't checked out the market report for your area, what are you waiting for! It's a great tool and it's free!
Of course if you ever have questions about Real Estate or are thinking of buying or selling, I'd love to hear from you. You can give me a call at 954-557-7036 or email debbie@SouthFLHomes.com.